Illustrated Explainer Video for Graph Database Workflows
For Elephant Bird Consulting, I created a custom illustrated explainer video to help explain a graph database workflow: from initial client requirements to architecture, database administration and developer implementation.
The project was commissioned by Tom Geudens, a graph database specialist and O’Reilly author, and required a visual approach that could make a technical process clear without turning it into generic software marketing. The result was a short, character-led animation built around custom business illustration, workflow visualization, technical storytelling and explainer video production.
This project connects closely with my wider work in hand-drawn explainer videos and whiteboard animation, business illustration, character design and visual communication systems.

Visualizing a technical process without losing precision
Graph database design can quickly become abstract for non-specialist audiences. Nodes, relationships, data structures, implementation logic and team responsibilities are clear to specialists, but harder to communicate to clients, internal stakeholders or mixed technical and business audiences.
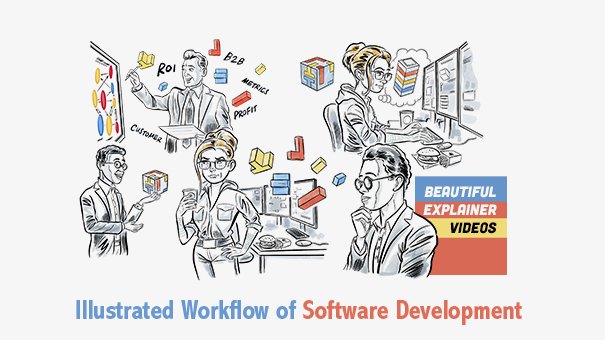
The visual task was to turn that workflow into a sequence of understandable stages. The video follows the movement of information from one role to another: the client defines the need, the architect interprets and structures the problem, the database administrator prepares and manages the data environment, and the development team implements the solution.
Rather than relying on generic technology icons or stock-style interface graphics, the animation used a custom cast of characters and visual metaphors. This made the workflow easier to follow while keeping the subject grounded in the real logic of technical collaboration.

Character-led business illustration for software and data topics
The project sits between technical illustration, business illustration, software workflow visualization and animated explainer video production. The aim was not to create decorative technology imagery, but to build a visual narrative that could explain how different people and responsibilities fit together inside a graph database project.
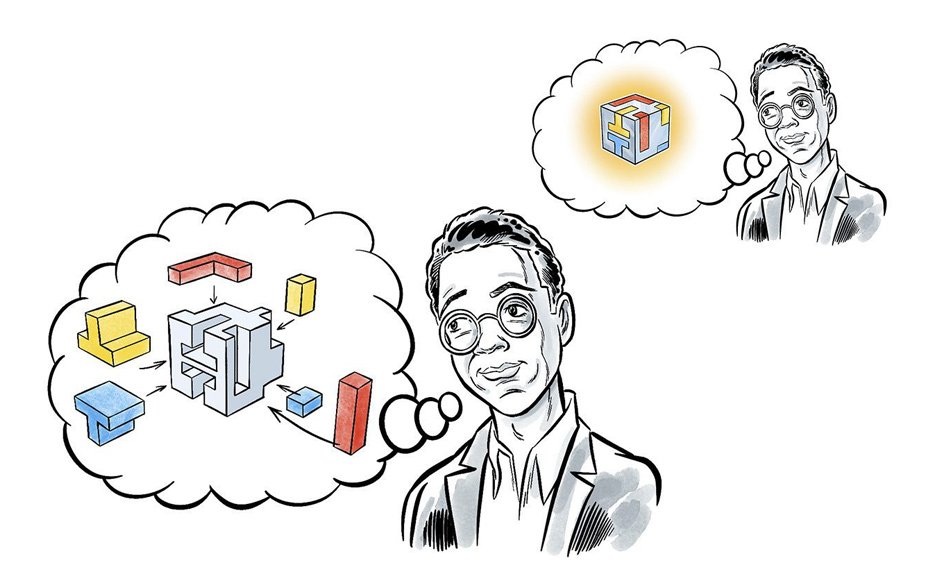
Characters are useful in this kind of communication because they make roles visible. A client, architect, database administrator or developer can be shown thinking, handing over information, questioning a structure, or collaborating on implementation. Those actions are often more readable than abstract diagrams alone.
At the same time, the illustration had to remain disciplined. The drawings needed to support the technical subject, not distract from it. That meant using clear staging, readable silhouettes, restrained visual jokes and symbolic objects that could carry meaning quickly.

The finished explainer video
The video below shows the finished illustrated animation. It was created to explain a technical workflow through a simple sequence of roles, actions and visual metaphors.

From script to storyboard, illustration and animation
My role covered the visual development and production of the explainer video: interpreting the concept, developing the character system, shaping the storyboard, producing the finished illustrations and preparing the animated sequence.
This kind of project benefits from a direct studio model. The same person who understands the visual problem also develops the drawings, staging, character logic and animation structure. That reduces the risk of the project becoming fragmented as it moves from script to storyboard to illustration to final motion.
For technical subjects, that continuity matters. A software workflow, database architecture or data infrastructure topic can easily become confusing if the visuals are attractive but imprecise. The production process therefore has to balance accessibility with conceptual accuracy.


Explainer videos for software, data and specialist business communication
Explainer videos are often used for product marketing, but they are also very effective for more specialist forms of communication: software concepts, internal workflows, data infrastructure, onboarding, sales enablement, technical training and conference presentations.
The value of custom illustration in this context is that the visual language can be built around the actual subject. A graph database workflow does not need to look like a generic technology deck. It can have its own characters, metaphors, pacing and visual logic while still remaining professional and clear.
For companies, consultants, software teams and technical organizations, this kind of visual storytelling can make complex material easier to present, discuss and remember.

Project information
Project: Illustrated explainer video for graph database workflows
Client: Elephant Bird Consulting / Tom Geudens
Subject: Graph database design, project workflow, software architecture, database administration and developer implementation
Services: Visual concept, storyboard, business illustration, character design, workflow visualization, animation assets and explainer video production
Illustration and production: Ian David Marsden / Marsden Creative
Use case: Technical communication, software explanation, business presentation, data workflow communication and specialist consulting content
Related services
This project connects closely with my work in hand-drawn explainer videos and whiteboard animation, business illustration, editorial and educational illustration, character and mascot design and creative direction and visual communication.
For a broader overview of selected client work, see my case studies, client overview or download a concise illustration portfolio PDF.
Ian David Marsden is an illustrator, creative director, cartoonist and visual storyteller based near Montpellier, France, working internationally in English, French and German for companies, agencies, publishers, institutions and organizations.